|
|
||||
 |
||||
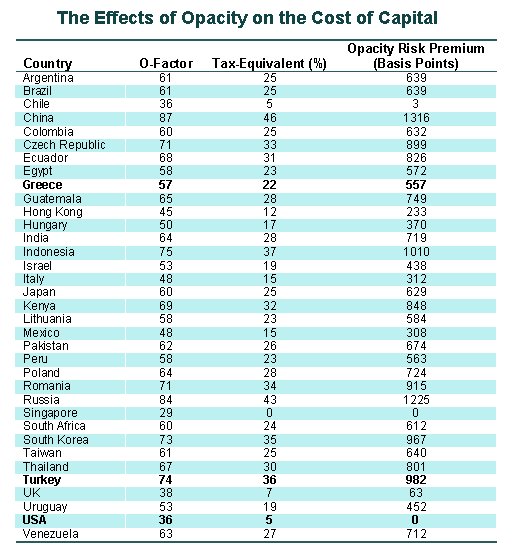
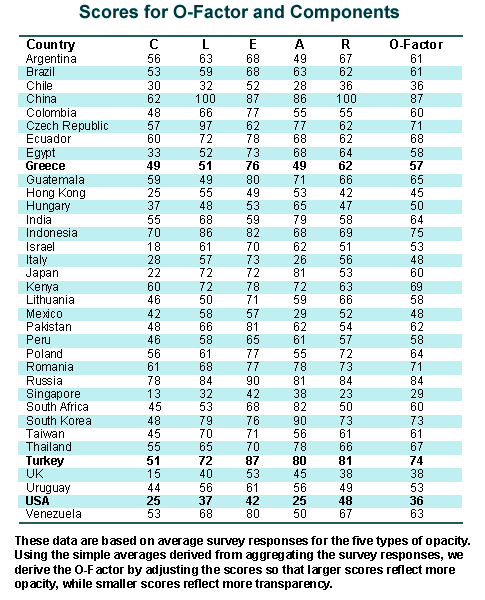
 By Christos and Mary Papoutsy Founders and Publishers, Hellenic Communication Service What does corruption in business and government cost the average citizen in Greece and other countries? The Opacity Index, developed by PricewaterhouseCoopers, provides some answers. The index measures levels of opacity, defined as "the lack of clear, accurate, formal, easily discernible, and widely accepted practices." Greece is ranked 57th, a score which indicates that the Mediterranean nation is less vulnerable to corruption than longtime regional rival Turkey, but more vulnerable than the United States, Britain, and Italy. A recent editorial posted on Hellenic Communication Service reported that Greece was ranked ranked 36th out of 99 nations, as measured by Transparency International's Corruption Perception Index (CPI). But the Transparency International index, which measures bribes received by governments and their officials, reflects only one aspect of a very complex picture. Thanks to the efforts of Transparency International and other organizations, measures of perceived corruption in countries worldwide have become important indicators for many participants in global markets. While the Opacity Index correlates significantly with other indices, it should be viewed as a new indicator, raising new questions in the five CLEAR areas of concern and giving new results. The task of estimating the economic cost of opacity required several steps. First, a global survey team interviewed corporate leaders, banking executives, equity analysts, and well-informed in-country staff of PricewaterhouseCoopers in selected countries during the third and fourth quarters of the year 2000. Second, a team of economists generated individual scores for the five areas to create an overall opacity score, the O-Factor, for each country in the sample. Third, the economists used the opacity score in conjunction with data on international capital flows (foreign direct investment and portfolio flows) to determine the economic impact of opacity on the cost and availability of capital in the 35 countries.
This overall exercise created three streams of related data: 1) the O-Factor scores, 2) measurements of the risk premium attributable to opacity when countries borrow throuhg sovereign bond issuances in international or domestic capital markets, and 3) calculation of the effects of opacity as if it imposed a hidden surtax on foreign direct investment (FDI) -- a tax payable not to a government but, more obscurely, levied by and lost in the weave of opaque business practices. In a short time, we plan to publish a fourth data set, estimating the extent to which opacity deters foreign direct investment. This is an area of great interest and considerable complexity. The PricewaterhouseCoopers Opacity Index, launched in January 2001, provides a new measure of the effects of corruptoin on the cost and availability of capital (the cost of borrowing funds), in a number of countries. The Opacity Index offers a composite "O-Factor" for each country, based on opacity data in five different areas that affect capital markets: a) corruption, b) legal system, c) economic and fiscal policies, d) accounting standards and practices (including corporate governance and information release) and regulatory regime. From these elements a useful acronym, CLEAR, emerges as a means of keeping in mind the multiple aspects of opacity/transparency in capital markets. The O-Factor and related data on real yet unnecessary costs should encourage countries and businesses to promote more transparent practices in the five CLEAR areas. Conclusion: As the world's markets, in the era of "globalization," become more interdependent, it becomes obvious that one country can differ from another in the clarity and consistency of their approaches to managing their economies. Some national economies are relatively transparent, while many others are relatively opaque. The PricewaterhouseCoopers Opacity Index brings a degree of clarity to the subject of costs related to corruption. Supporting data may be viewed and downloaded by logging onto http://www.opacityindex.com/ind_whatwhy.html.
|
||||
 |
||||
|
O-Factor is the score of a country based on the survey responses. High numbers indicate a high degree of opacity, and low numbers indicate a low degree of opacity.
Tax Equivalent shows the effect of opacity when viewed as if it imposes a hidden tax. For example, the number 30 indicates that opacity in that country is equivalent to levying an additional 30-percent corporate income tax. Risk Premium indicates the increased cost of borrowing faced by countries due to opacity, expressed in basis points (100 basis points = one percentage point). On average, countries with more opacity tend to have to pay a higher interest rate on the debt they issue. For example, a score of 900 would indicate that countries need to pay international investors an extra 9 percent on their sovereign debt due to opacity. Some opacity premiums in this tabulation are higher than the actual interest rate at which the corresponding country is able to borrow. This apparent anomaly is explained by certain capital markets dynamics and by hidden subsidies. *Where zero (0) is reported in the table, that country served as the benchmark level of opacity for the calculations.
|
||||
 |
||||
